Finding SQL Queries in the Blackfire Call-Graph
Learn how to filter the call-graph functions list to find a SQL query.
When working on more and more complex applications, we can sometimes get dizzy browsing through a call-graph with a huge amount of nodes.
I see nodes… Lots of nodes…
In a Call-Graph, each node represents a function call in your application. In addition, in the left column, the Functions tab presents a list of every profiled functions. This list can be sorted out in different ways, and it can also be filtered out via the search field.
One of the first ideas we may have is to use the search field by typing a function or a class name. This is efficient when we know exactly what we are looking for, e.g. a specific class.

However, this can become quite challenging when we are looking for something more specific, like a SQL query.
Looking for a SQL Query
Where my SQL request is coming from?
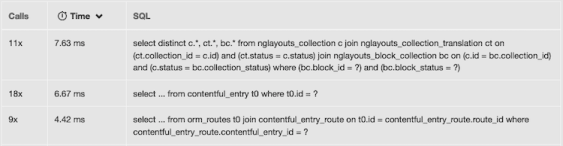
Let’s consider the following list of SQL queries, extracted from a Blackfire profile of the WebSummerCamp website:

We can see one SQL request called 18 times. What if we want to know where it comes from in the call-graph? Let’s use the Functions search field and type the SQL query itself:

Et voilà 😊!
The filter indeed operates on captured arguments as well, which makes it possible to spot the right function call (here PDOStatement::execute()). We can now click on the magnifying glass 🔍 in order to center the call-graph on the corresponding node.
Speaking of which, the filter also works with any captured argument, which you can define in your own metrics (read more in the Metrics Revolutions article).
Filter by Metrics
You may have noticed that PDOStatement::execute() is part of sql.pdo.queries metric, which itself is part of sql.queries metric. This information is displayed by the Metrics Explorer, which I described in the Metrics Reloaded article.
An alternative to the method described earlier would be to filter by metric. Try to type sql.queries in the search field:

All calls to PDOStatement::execute() now appear in the function list. You can now click on each result item to make the SQL query appear!
Want to Know More About your SQL Queries?
One more thing…
It is important to remind us that, before sending the aggregated profile to Blackfire servers, the Agent anonymizes your data, including your SQL queries.
However, it may be useful to temporarily disable anonymization in order to get the entire queries; this would for example help debugging very complex ones.
The good news is that this is made possible by the Debug add-on!
Here are a small example of SQL queries from a profile without and with the Debug add-on:

Happy SQL profiling!