Python Memory Profiling with Blackfire
Memory is often an overlooked performance metric. Blackfire’s memory profiler traces every memory block allocated by Python, including C extensions using Python’s memory manager.
Version 1.4.0 of Blackfire Python probe enables memory profiling. Blackfire’s memory profiler traces every memory block allocated by Python, including C extensions using Python’s memory manager.
Key features:
- its overhead is very limited and does not impact end-users by default;
- memory consumption is measured at the function call level.
Currently, it supports Python versions 3.5 and up.
Interested in the details? Blackfire memory profiler uses PyMem_SetAllocator API under the hood to trace memory allocations like tracemalloc. And this is achieved while having a lower overhead than tracemalloc (in a single threaded context – we’ll tell more in a future blog post).
Use Cases
There are various problems that can be analyzed/debugged with the help of a memory profiler:
- lingering large objects in memory
- reference cycles
- C extensions leaking memory due to invalid reference counting
- sudden memory spikes
A real world example
Let’s try to diagnose and fix a common real world problem in Django.
In the Django world, Queryset is like its name says: a collection of queries. Usually, instead of writing raw SQL queries, you use Queryset APIs to store/retrieve data which is more convenient. Django Queryset‘s are both:
- lazy;
- cached (there are situations where a
Querysetis not cached).
This means that every time a Queryset is evaluated, the results will be held in memory. This is a nice feature as you usually get an object from the database and access it multiple times:
comment = Comment.objects.get(id=1)
comment.user # User object is retrieved from db
comment.user # cached version
However, caching might become problematic ifQueryset returns lots of entries and you only access the entries returned once.
Caching lots of entries will lead to sudden spikes in memory consumption which might cause OOM (Out of Memory) errors all over the place affecting other requests as well. It makes sense to analyze and control how much memory is consumed and/or peak in a specific request to avoid situations like these.
Let’s assume we have following Model:
class Comment(models.Model):
    comment = models.CharField(max_length=255)
    user = models.ForeignKey(User, related_name="user_comments")
The view retrieves all the comments generated by the user:
def comments(request):
    ...
    comments = request.user.user_comments.all()
    ...
    template = loader.get_template('comments.html')
    context = {'comments': comments}
    return HttpResponse(template.render(context, request))
And this template:
<body>
    <h1>Comments</h1>
    <ul>
        {% for comment in comments %}
            {{ comment }}
        {% endfor %}
    </ul>
</body>
If the user has made a significant number of comments, the simple looking code comments = request.user.user_comments.all() might spike in memory.
Let’s see that in action with Blackfire:

You can see that ~80MB of memory is allocated for caching the Comment model.
Django provides a simple way to disable internal caching of models: the iterator() method. iterator() evaluates the Queryset and returns an iterator over the results.
Let’s change our view code and profile again:
def comments(request):
    ...
    comments = request.user.user_comments.all().iterator()
    ...

We can see that a single line of change reduced the memory consumption from ~81Mb to ~4Mb.
Let’s see if other dimensions are affected, too. Blackfire provides a comparison feature where you can compare two independent profile sessions. When we compare the two above, we get following:
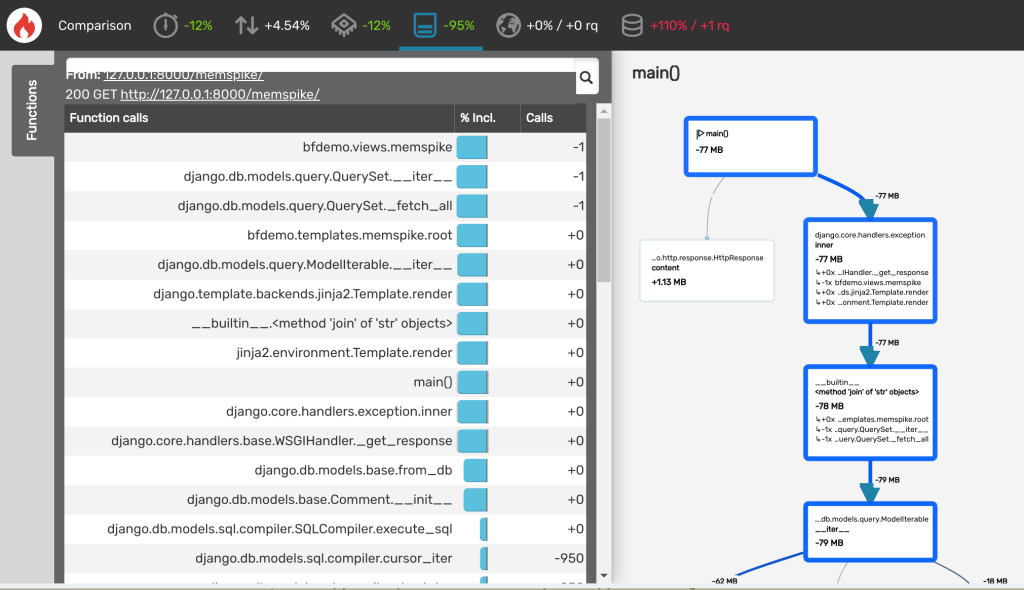
As can be seen from the visualization, we have a ~%95 improvement over memory consumption and even ~%10 improvement over Wall and CPU time.
Memory Profiling is Key for Code Performance
Memory is often an overlooked performance metric. Especially for a highly dynamic language like Python. It’s often only once a memory leak or other types of memory issues hit production servers that we might detect them and lead us to wonder about memory usage. And if you don’t have the right tools to measure, you cannot optimize.
Blackfire lets you see all performance metrics like memory consumption, CPU and Wall time together in a single profile session which can aid debug performance issues like this even before they hit production.
Get started with Blackfire for Python now.
Happy Python memory profiling!